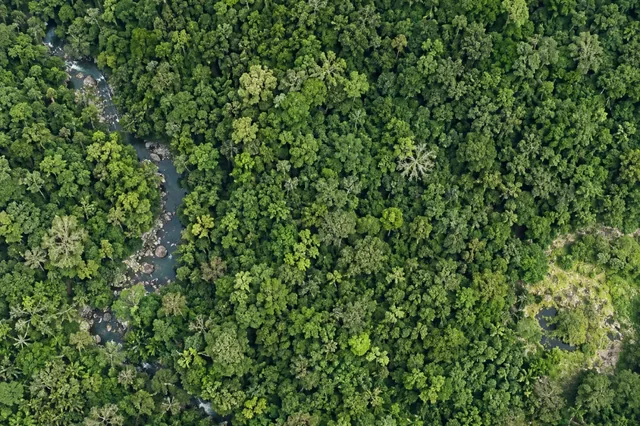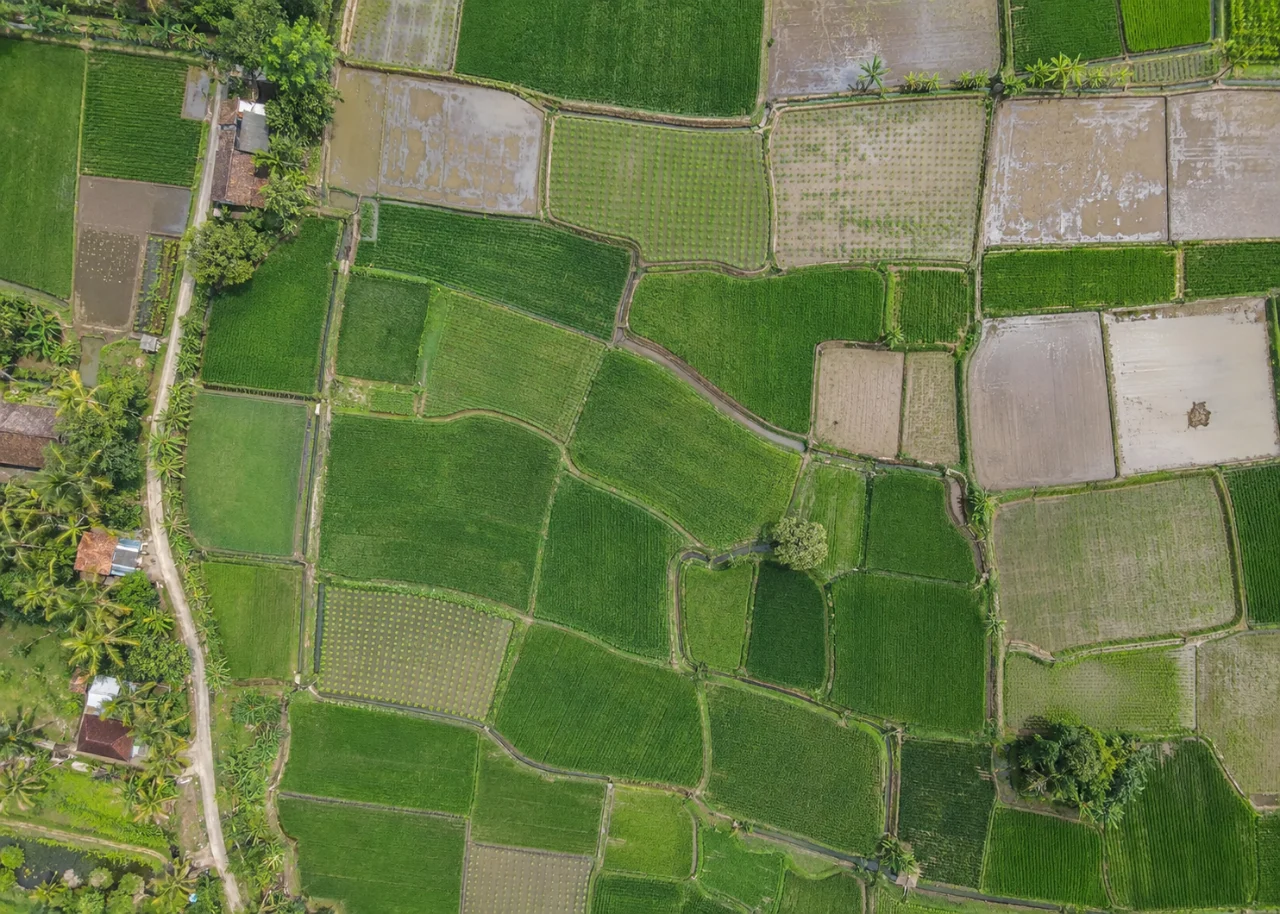
Start with the operational question
A crop time series needs consistent geographic support and a reliable calendar of planting, management and observations. Tracking the same zones through establishment, canopy expansion and senescence can describe development patterns. The interpretation becomes stronger when image-derived trends are linked to actual field stages.
The working question is: Which apparent seasonal changes reflect crop development rather than inconsistent observation conditions? Define phenology observation series before the survey begins and identify who will review them. Agree what evidence would change an inspection, sampling or management decision. This keeps the map tied to a testable task and makes it possible to distinguish a useful observation from an attractive output that cannot resolve the question.
Understand what the image actually observes
Changing camera exposure, illumination, masks or flight geometry can create artificial jumps. Different crop cycles within one boundary can also produce a smooth-looking trend with no coherent biological meaning. Missing dates should not be disguised as measured values.
For phenology observation series, the measurement definition is part of the result. Keep the measurement support explicit: a pixel, a segmented object, a sample plot and a management block represent different areas and sources of variation. Changing pixel size does not create independent information or improve the underlying sensor observation. Decide whether the task concerns locating targets, estimating area, comparing numeric observations or predicting a field property. Each requires a different evaluation denominator. Preserve uncertain labels and unobservable regions so a complete-looking classification cannot hide missing evidence. The final quality claim should refer to the actual task, geography and conditions tested.
Design capture around the target and its confounders
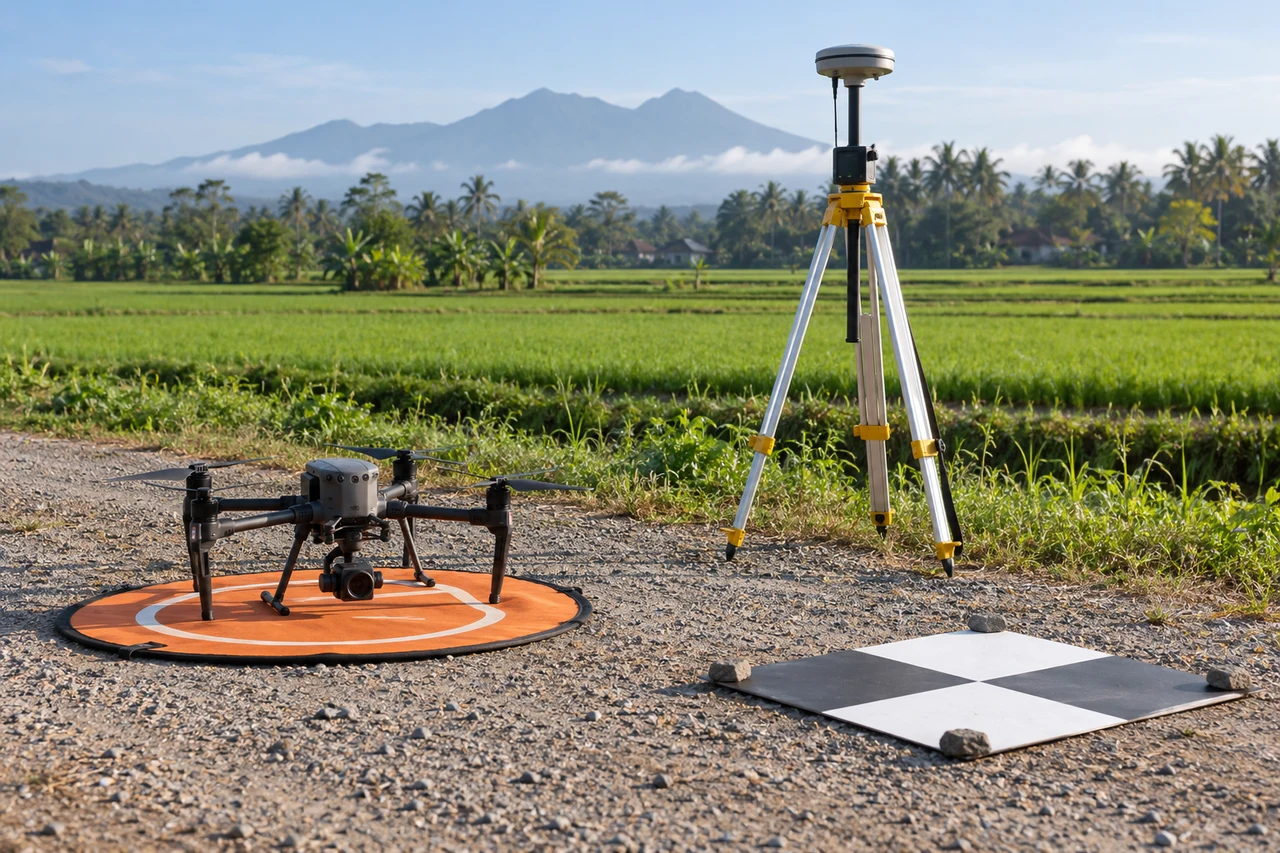
Capture planning for phenology observation series should begin with the intended comparison. Design the observation and reference collection together. List the target, the sensor response that could distinguish it, the expected confounding surfaces and the scale at which a decision is made. Capture representative easy and difficult conditions rather than only a visually clean demonstration. Retain acquisition time, camera information, calibration records and relevant environmental context. Where multiple bands or dates are involved, plan a way to evaluate their alignment and comparability. A small pilot should reveal whether the proposed feature is actually observable before a larger automated analysis is treated as a reliable measurement.
Build a traceable processing and analysis workflow
Create stable analysis zones, attach planting and management events, and record capture and processing versions. Review each observation independently before joining the series. Preserve gaps where observations fail. Compare developments relative to crop stage where appropriate, and test whether trends remain after excluding low-quality dates.
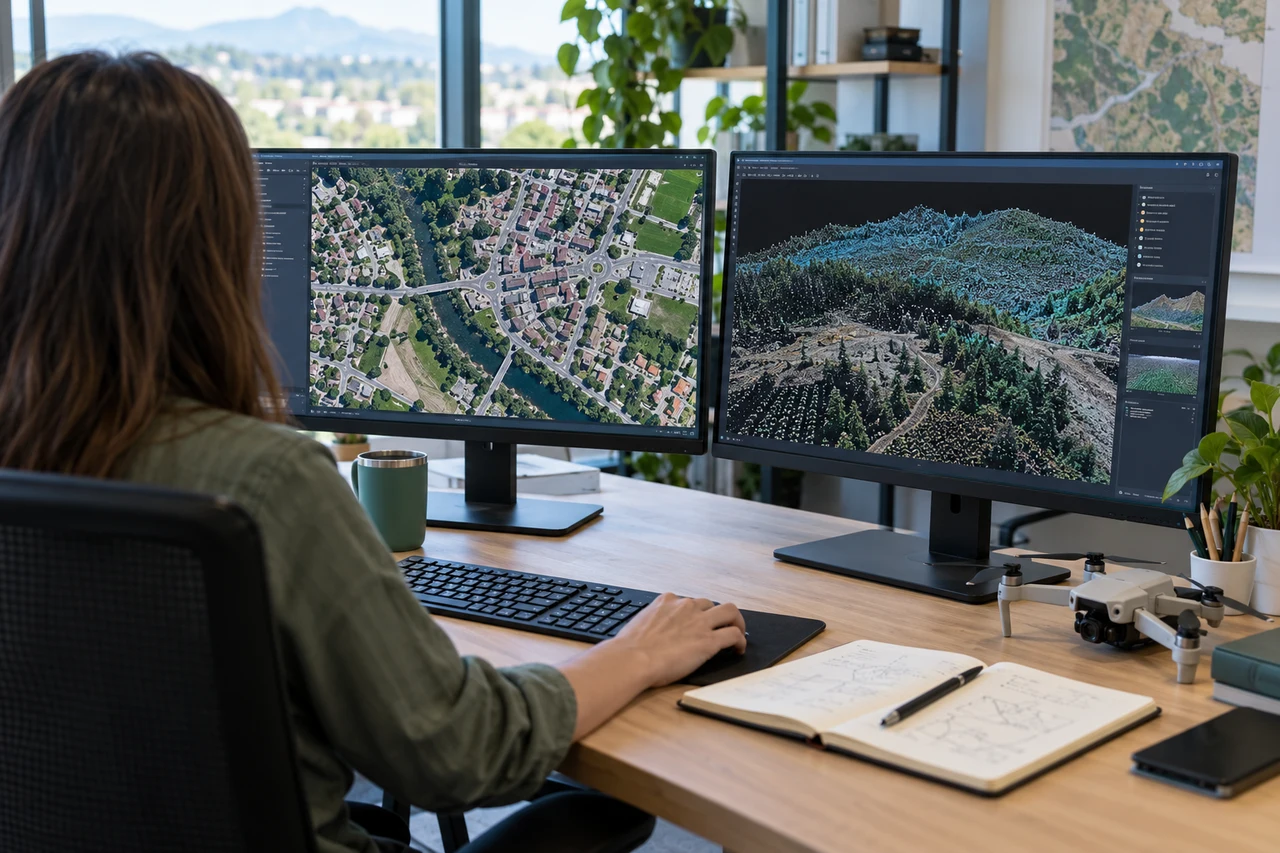
Quality review for phenology observation series must continue after processing completes. Preserve raw or original numeric inputs alongside display products. Verify formulas, band identities, masks, coordinate references and resampling choices. Review representative source-to-output locations and inspect whether seams, edge pixels or mixed surfaces dominate the feature of interest. Record preprocessing and model versions so an update can be reproduced. Use independent evaluation units that reflect deployment, not merely convenient random pixels. Compare a proposed sophisticated feature with a simpler baseline; additional complexity is justified only when it improves the specified measurement or decision under a fair evaluation.
Work through an illustrative example
Suppose an illustrative zone’s cover rises from 20% to 55% to 80%, then falls to 10%. The last drop may be harvest rather than stress. Without an event register, a reasonable seasonal sequence can be misreported as sudden crop failure.
This example for phenology observation series is deliberately illustrative, not a reported outcome or an accuracy promise. Replace its assumptions with the project’s measured values before using the reasoning operationally. Keep the numerator, denominator, observation date and exclusions visible. If a plausible boundary, visibility or reference change alters the decision, collect the missing evidence or retain the case as unresolved rather than reporting extra decimal places.
Validate with independent field evidence
Record stage and canopy observations at repeated marked locations. Include timing of irrigation, pruning or harvest. Check unusual curve segments with source images and field notes before interpreting them.
An evaluation of phenology observation series should include both flagged targets and suitable unflagged reference locations. Checking only the most obvious candidates can estimate neither the missed targets nor the full false-alarm pattern. Separate observations used to adjust the method from those used to evaluate it. Keep the sampling unit and selection method explicit, and report difficult or unobservable cases rather than dropping them silently. When field timing differs from image timing, explain whether the site could have changed between visits. A disagreement is evidence to investigate, not an instruction to force the ground record to match the map.
Resolve the topic-specific interpretation risks
Phenology records should state whether the series uses calendar time, days after planting or field-observed stage. Each can answer a different question, and mixing them can create confusing site comparisons. Mark interpolated values clearly if an analysis uses them; they are not new observations. Retain the unfiltered series and quality flags so an unusual event can be reviewed rather than removed automatically as noise. Where a processing version changes, reprocess a representative overlap period or quantify the discontinuity before interpreting a jump as crop development.
Hand over evidence that the receiving team can use
Deliver a time series with actual observation dates, quality flags and event markers. Use the curve to frame field questions, and keep any yield or condition prediction separate unless independently evaluated.
For the phenology observation series handover, retain stable identifiers, the source observation date, the coordinate reference, the analysis boundary and the valid-observation status. Supply both an accessible overview and the relevant geospatial data where needed. Attach a short exception register that explains unresolved features and the next useful check. If the data are revised, preserve the reason and version so quantities or statuses can be traced. Ask the receiving team to locate a sample item and interpret its confidence; that practical review often reveals missing context that a file-integrity check cannot detect.
When evaluating Drone Image Processing Software for phenology observation series, assess the complete workflow with a representative dataset. DroneCollab can be considered for preparing photogrammetric mapping outputs, while task-specific interpretation and field validation remain essential. Compare the required exports, review process and actual pilot evidence before selecting a workflow for recurring work.