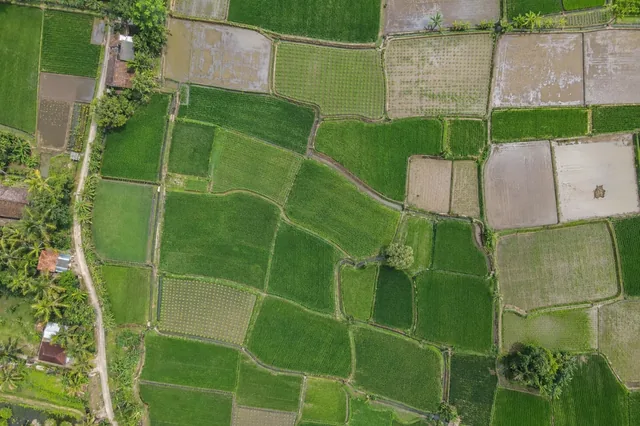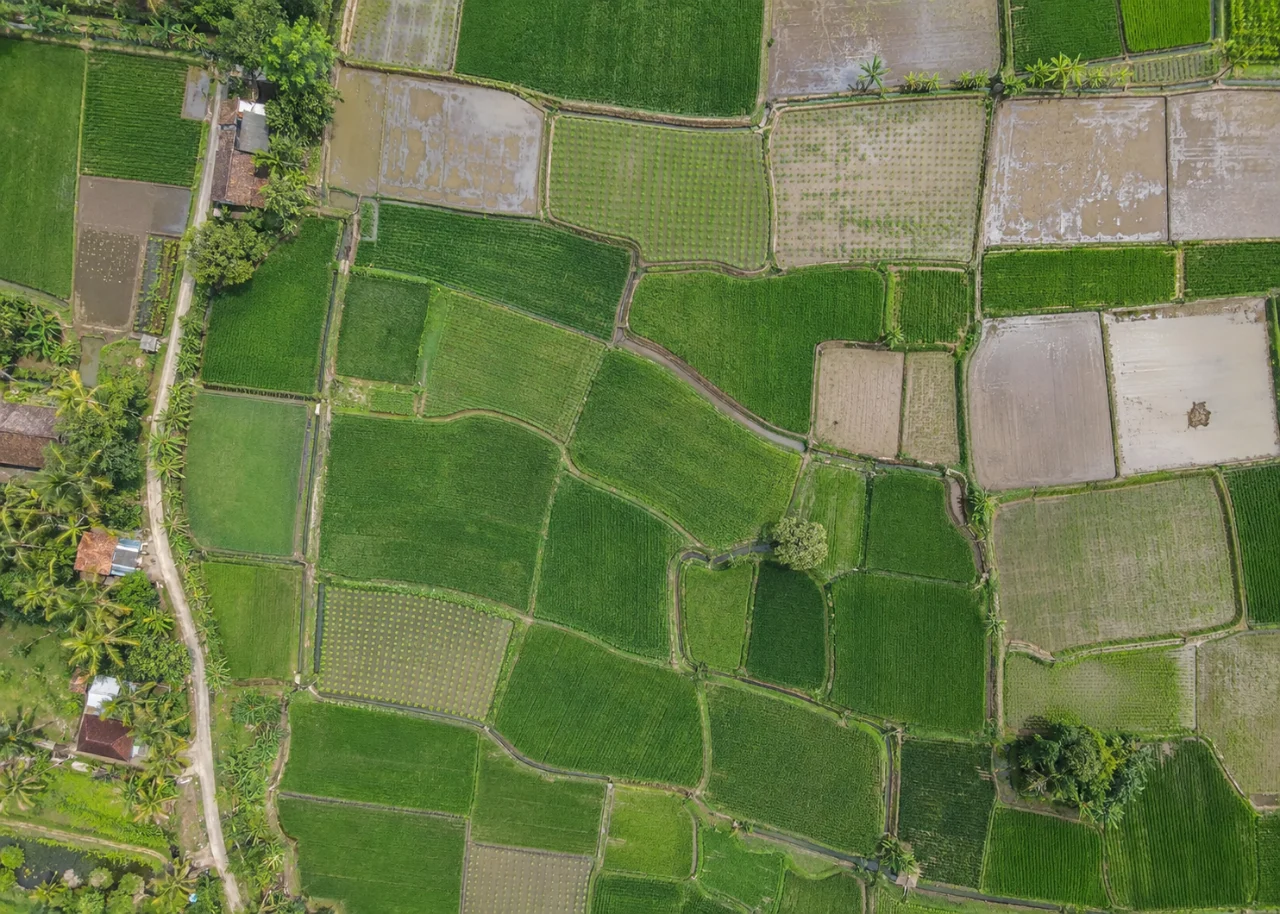
Start with the operational question
Thermal imagery can reveal spatial differences in apparent canopy temperature when capture and calibration are appropriate. Interpretation requires separating leaves from exposed soil, water and artificial surfaces. The useful question is whether a coherent pattern remains after weather, canopy coverage and measurement conditions are considered.
The working question is: Which canopy-temperature patterns deserve water-stress checks under the observed conditions? Define thermal crop assessment zones before the survey begins and identify who will review them. Agree what evidence would change an inspection, sampling or management decision. This keeps the map tied to a testable task and makes it possible to distinguish a useful observation from an attractive output that cannot resolve the question.
Understand what the image actually observes
Hot soil inside a sparse canopy can dominate a pixel. Wind, humidity, solar loading and irrigation timing change temperature patterns, while emissivity and sensor processing affect numeric values. A warm patch is not a unique diagnosis of plant water stress.
For thermal crop assessment zones, the measurement definition is part of the result. Separate the planted area from roads, bunds, headlands, permanent vegetation and water where these are outside the assessment definition. Decide whether the measurement unit is a plant, row length, patch or management block, and keep that unit consistent through analysis and reporting. Soil background, crop age and canopy overlap affect what is observable. Maintain an unknown or obscured class instead of forcing every location into good or poor condition. A transparent denominator and valid-observation fraction make the resulting agricultural comparison much easier to interpret than a single whole-farm percentage.
Design capture around the target and its confounders
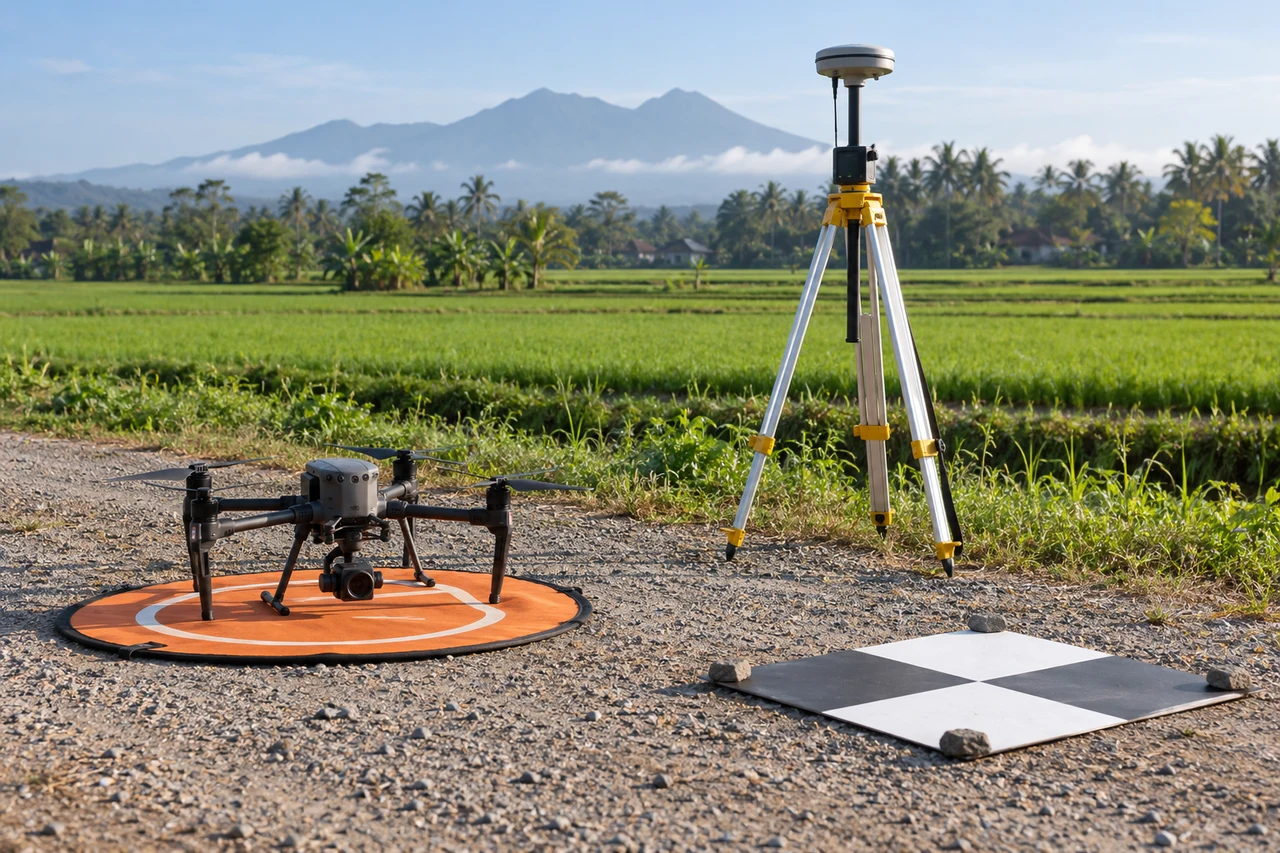
Capture planning for thermal crop assessment zones should begin with the intended comparison. Choose an observation window that matches crop stage and the field question. Record planting dates, recent irrigation, rainfall and management events. Inspect sample photographs for blur and confirm that the smallest relevant crop feature is visible before committing the entire field to processing. Keep repeated observations as comparable as practical in illumination and camera configuration, while recording unavoidable differences. Where reflectance-based indices are required, use suitable spectral bands and an evaluated radiometric workflow; an ordinary RGB color adjustment is not equivalent to measuring near-infrared reflectance. Include representative intact crop as well as the suspected anomaly in the planned coverage.
Build a traceable processing and analysis workflow
Record weather and irrigation state, assess sensor calibration and create a canopy mask using compatible imagery. Compare similar crop stages and illumination conditions. Inspect source frames for drift or abrupt changes, then map relative patterns with an explicit observation time rather than assigning a universal stress threshold.
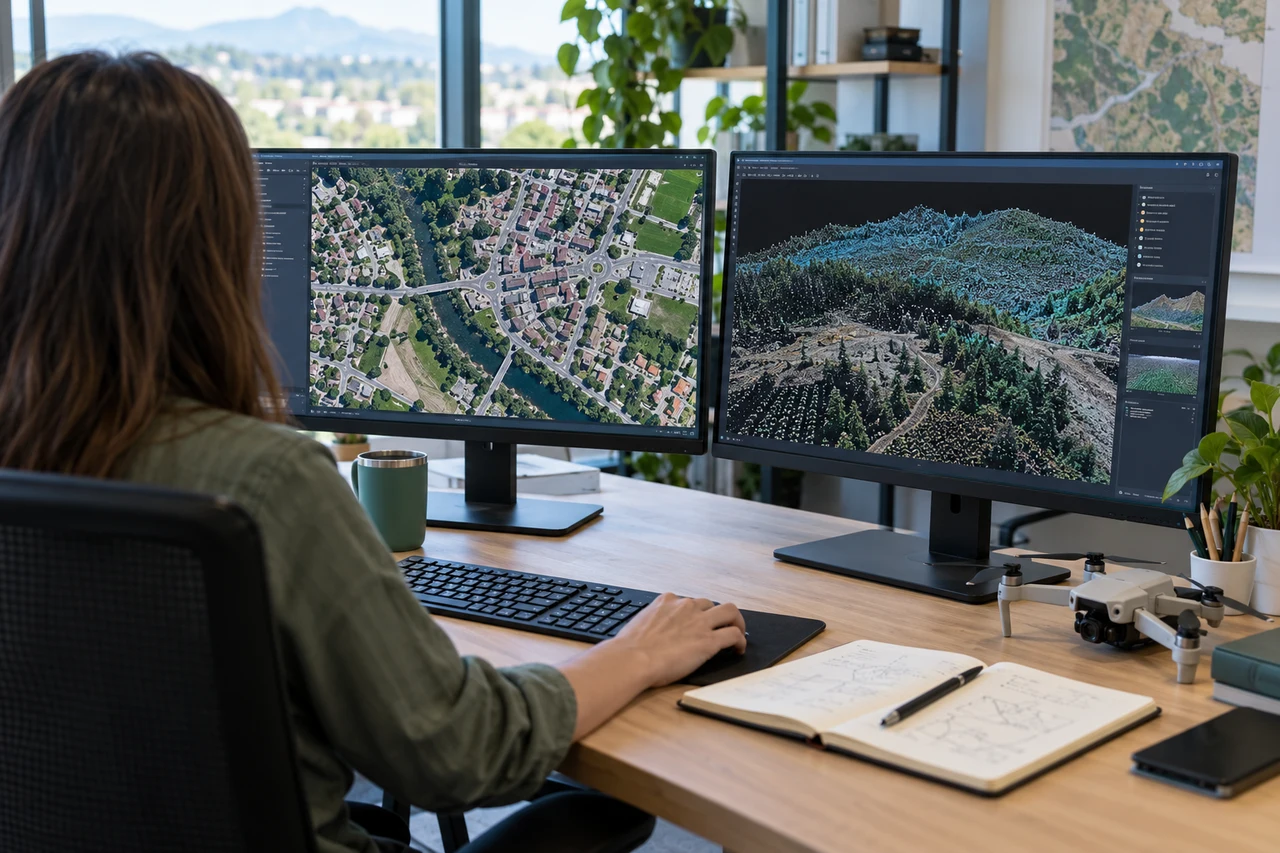
Quality review for thermal crop assessment zones must continue after processing completes. Review a low-resolution alignment before relying on full outputs, then inspect the finished mosaic against original frames at anomaly edges. Reject blur, severe seams and unsupported areas rather than smoothing them into an apparently complete crop map. If an index is used, verify band identity, alignment and invalid values. If structure is used, inspect the point cloud and surface support instead of assuming every raster cell is measured. Summarize distributions and valid area within the intended crop units, preserving the field identifiers needed by agronomists and operations staff.
Work through an illustrative example
Suppose hypothetical zones differ by 3 degrees in apparent temperature, but one contains much more exposed soil. After canopy-only masking, the contrast falls to 1 degree. The first contrast mixed surfaces; the smaller contrast still needs field evaluation before it can support an irrigation decision.
This example for thermal crop assessment zones is deliberately illustrative, not a reported outcome or an accuracy promise. Replace its assumptions with the project’s measured values before using the reasoning operationally. Keep the numerator, denominator, observation date and exclusions visible. If a plausible boundary, visibility or reference change alters the decision, collect the missing evidence or retain the case as unresolved rather than reporting extra decimal places.
Validate with independent field evidence
Measure relevant plant or soil water-status indicators using an appropriate field protocol and include reference zones. Record exact sampling time because crop temperature can change during the visit. Check whether the mapped pattern agrees with independent observations.
An evaluation of thermal crop assessment zones should include both flagged targets and suitable unflagged reference locations. Checking only the most obvious candidates can estimate neither the missed targets nor the full false-alarm pattern. Separate observations used to adjust the method from those used to evaluate it. Keep the sampling unit and selection method explicit, and report difficult or unobservable cases rather than dropping them silently. When field timing differs from image timing, explain whether the site could have changed between visits. A disagreement is evidence to investigate, not an instruction to force the ground record to match the map.
Resolve the topic-specific interpretation risks
Thermal crop scouting should preserve canopy fraction alongside the temperature summary. A zone with very little visible foliage can be too mixed for a plant interpretation even when the numeric image appears smooth. Compare repeated observations only with enough weather and operating context to explain their differences. If field water-status measurements disagree with the thermal ranking, investigate timing, masks and sensor behavior before discarding the ground evidence. The disagreement is valuable: it shows which assumptions need testing before the workflow is used to prioritize irrigation actions.
Hand over evidence that the receiving team can use
Provide a timed thermal scouting map with canopy coverage and quality flags. Keep irrigation recommendations with the agronomist and operational measurements, using aerial temperature as one line of evidence.
For the thermal crop assessment zones handover, retain stable identifiers, the source observation date, the coordinate reference, the analysis boundary and the valid-observation status. Supply both an accessible overview and the relevant geospatial data where needed. Attach a short exception register that explains unresolved features and the next useful check. If the data are revised, preserve the reason and version so quantities or statuses can be traced. Ask the receiving team to locate a sample item and interpret its confidence; that practical review often reveals missing context that a file-integrity check cannot detect.
When evaluating Cloud Photogrammetry Software for thermal crop assessment zones, assess the complete workflow with a representative dataset. DroneCollab can be considered for preparing photogrammetric mapping outputs, while task-specific interpretation and field validation remain essential. Compare the required exports, review process and actual pilot evidence before selecting a workflow for recurring work.