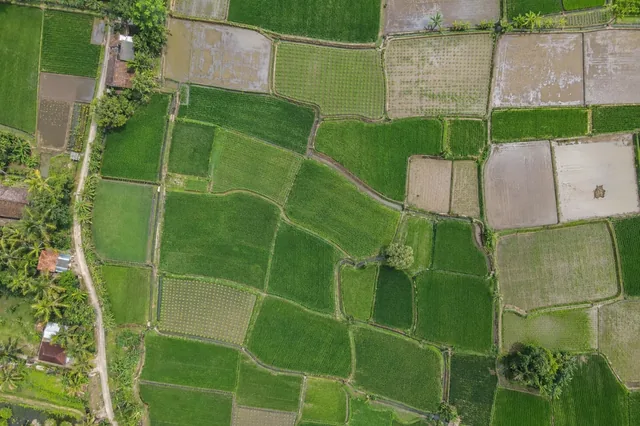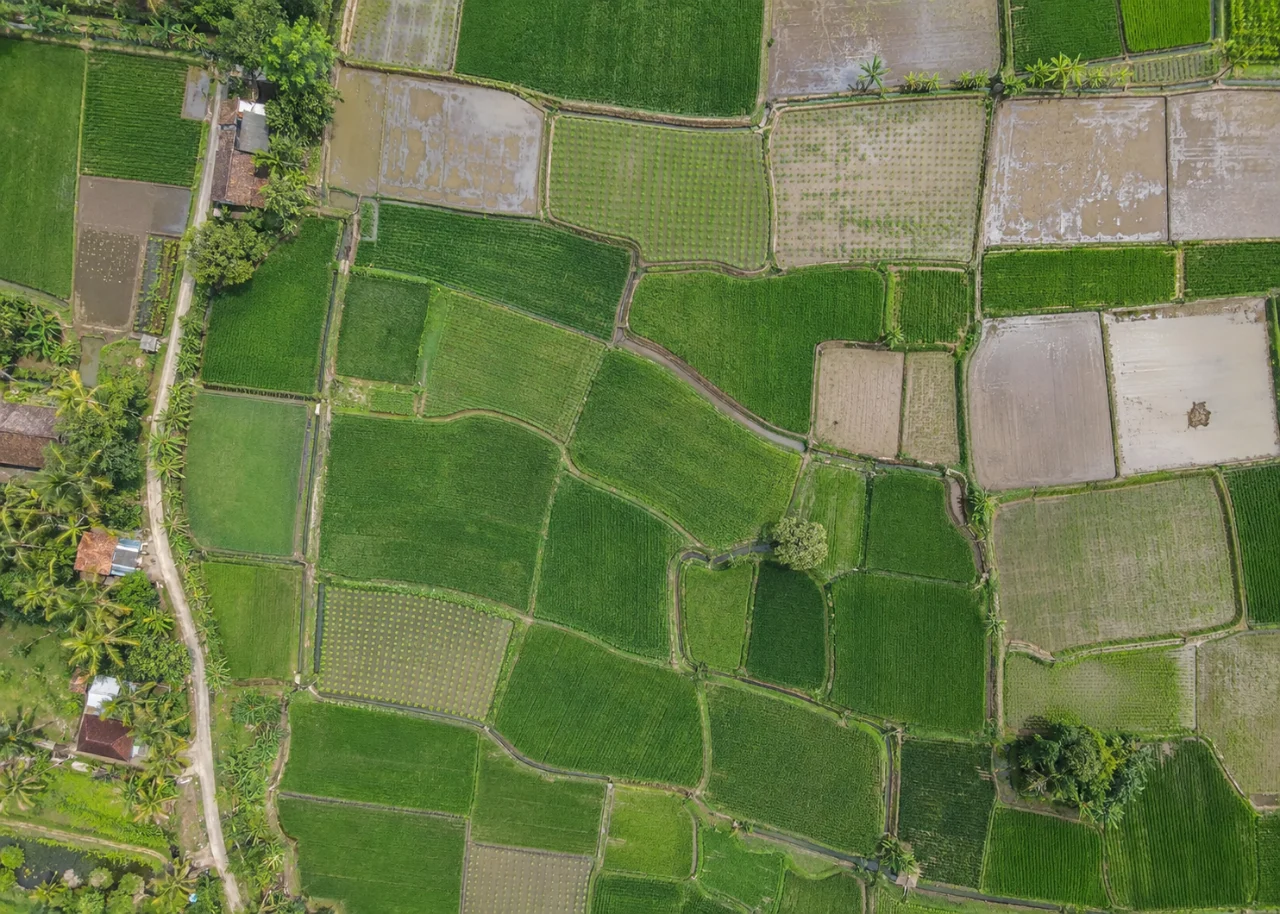
Start with the operational question
Flood recovery is a sequence rather than a single image interpretation. Separate visible standing water, exposed sediment, surviving green canopy and obscured crop. Retain the flood timing and crop stage because a map collected while water remains high cannot describe the same condition as a map collected after drainage.
The working question is: Where should post-flood rice recovery inspections focus as water recedes? Define flood recovery zones before the survey begins and identify who will review them. Agree what evidence would change an inspection, sampling or management decision. This keeps the map tied to a testable task and makes it possible to distinguish a useful observation from an attractive output that cannot resolve the question.
Understand what the image actually observes
Submerged or muddy plants may remain alive, while a green canopy can conceal damaged stems or roots. Reflections and sediment stains complicate color-based classification. A flooded-area outline is therefore an exposure record, not a verified map of irreversible crop loss.
For flood recovery zones, the measurement definition is part of the result. Separate the planted area from roads, bunds, headlands, permanent vegetation and water where these are outside the assessment definition. Decide whether the measurement unit is a plant, row length, patch or management block, and keep that unit consistent through analysis and reporting. Soil background, crop age and canopy overlap affect what is observable. Maintain an unknown or obscured class instead of forcing every location into good or poor condition. A transparent denominator and valid-observation fraction make the resulting agricultural comparison much easier to interpret than a single whole-farm percentage.
Design capture around the target and its confounders
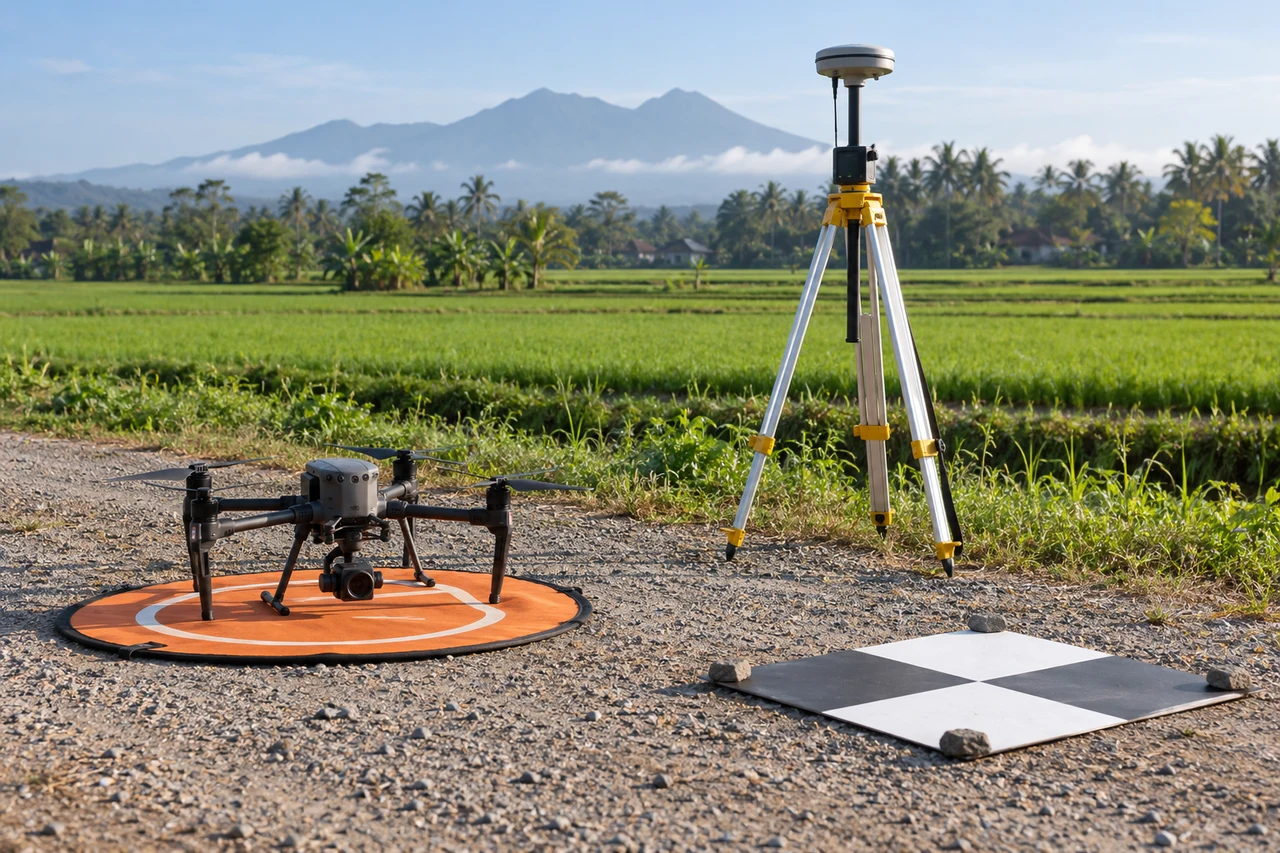
Capture planning for flood recovery zones should begin with the intended comparison. Choose an observation window that matches crop stage and the field question. Record planting dates, recent irrigation, rainfall and management events. Inspect sample photographs for blur and confirm that the smallest relevant crop feature is visible before committing the entire field to processing. Keep repeated observations as comparable as practical in illumination and camera configuration, while recording unavoidable differences. Where reflectance-based indices are required, use suitable spectral bands and an evaluated radiometric workflow; an ordinary RGB color adjustment is not equivalent to measuring near-infrared reflectance. Include representative intact crop as well as the suspected anomaly in the planned coverage.
Build a traceable processing and analysis workflow
Start with pre-event paddy boundaries and the best available baseline. Map observable classes, preserve an unknown class and repeat observations after access is restored. Compare the same crop masks across dates. Route field teams to persistent anomalous zones and transitions, including apparently recovered areas that might otherwise receive no checks.
Quality review for flood recovery zones must continue after processing completes. Review a low-resolution alignment before relying on full outputs, then inspect the finished mosaic against original frames at anomaly edges. Reject blur, severe seams and unsupported areas rather than smoothing them into an apparently complete crop map. If an index is used, verify band identity, alignment and invalid values. If structure is used, inspect the point cloud and surface support instead of assuming every raster cell is measured. Summarize distributions and valid area within the intended crop units, preserving the field identifiers needed by agronomists and operations staff.
Work through an illustrative example
Suppose a hypothetical 10-hectare block has 4 hectares visibly inundated on the first survey. A later survey shows 1 hectare still obscured and 3 hectares with exposed canopy. The latter area cannot be labeled recovered until plant survival and development are checked; the two maps describe changing visibility.
This example for flood recovery zones is deliberately illustrative, not a reported outcome or an accuracy promise. Replace its assumptions with the project’s measured values before using the reasoning operationally. Keep the numerator, denominator, observation date and exclusions visible. If a plausible boundary, visibility or reference change alters the decision, collect the missing evidence or retain the case as unresolved rather than reporting extra decimal places.
Validate with independent field evidence
Record live plant counts, sediment burial and crop stage in sampled zones. Include unaffected reference paddies with comparable management. Link each inspection to the most relevant image date, since a visit several days later may observe a different recovery state.
An evaluation of flood recovery zones should include both flagged targets and suitable unflagged reference locations. Checking only the most obvious candidates can estimate neither the missed targets nor the full false-alarm pattern. Separate observations used to adjust the method from those used to evaluate it. Keep the sampling unit and selection method explicit, and report difficult or unobservable cases rather than dropping them silently. When field timing differs from image timing, explain whether the site could have changed between visits. A disagreement is evidence to investigate, not an instruction to force the ground record to match the map.
Resolve the topic-specific interpretation risks
Post-flood monitoring should maintain separate records for flood exposure, current visibility and verified plant status. These are three related but different observations. A paddy can leave the visible-water class without returning to its previous crop condition, and a submerged paddy can contain surviving plants. Include the interval between flood peak, survey and field visit in the interpretation. When the exact flood peak is unknown, use the best documented event timing and state the limitation. That chronology helps recovery teams avoid treating a sequence of changing images as a sequence of confirmed losses.
Hand over evidence that the receiving team can use
Produce a dated recovery dashboard of observed classes and inspected outcomes. Let the agronomist evaluate rehabilitation choices from plant condition and remaining season, with the map explaining where evidence is still missing.
For the flood recovery zones handover, retain stable identifiers, the source observation date, the coordinate reference, the analysis boundary and the valid-observation status. Supply both an accessible overview and the relevant geospatial data where needed. Attach a short exception register that explains unresolved features and the next useful check. If the data are revised, preserve the reason and version so quantities or statuses can be traced. Ask the receiving team to locate a sample item and interpret its confidence; that practical review often reveals missing context that a file-integrity check cannot detect.
When evaluating Drone Mapping Software for flood recovery zones, assess the complete workflow with a representative dataset. DroneCollab can be considered for preparing photogrammetric mapping outputs, while task-specific interpretation and field validation remain essential. Compare the required exports, review process and actual pilot evidence before selecting a workflow for recurring work.