The site decision and observation unit
This guide examines raster resampling choices when a mapping team needs to maintain tree-level observations for orchard management. The goal is to connect a specific technical choice to observable site evidence, an independently checkable comparison and a clear delivery decision.
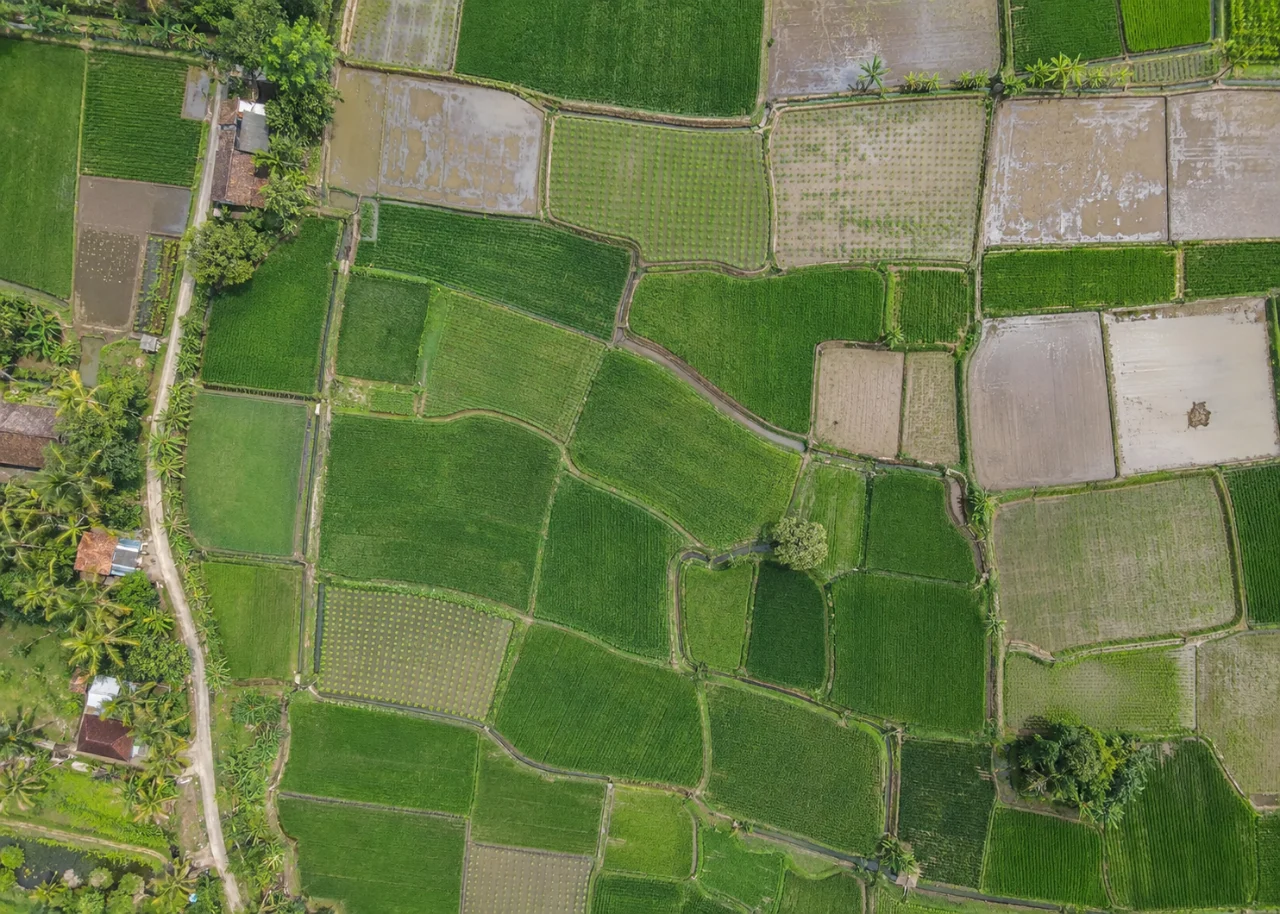
Identify orchard blocks, tree positions and planting ages before analyzing crowns. A tree crown visible in plan view is not identical to trunk position or fruit-bearing volume. Keep roads, pollinator rows and intentionally vacant positions in the site register. A stable tree identifier allows observations to be compared after pruning, replacement and seasonal canopy change.
Define the decision before choosing a processing configuration. State the target object, the observable surface, the required geographic reference and the evidence needed by the receiving user. Separate direct observations from inferred values. This prevents an attractive image from becoming an unsupported claim about conditions that the sensor did not observe. Preserve the project question in the run record so later quality review evaluates the intended use rather than a convenient software statistic.
The technical mechanism
Resampling estimates values on a different grid. Nearest-neighbor selection, interpolation and aggregation serve different data meanings. A method suitable for continuous elevation may be unsuitable for categorical classes. The target grid alignment and cell size influence which observations contribute, so a conversion must preserve both the geographic reference and the semantic meaning.
Site conditions that can mislead interpretation
Adjacent crowns can merge, shadows conceal young trees and pruning changes the visible boundary. Differences in species or planting age can exceed the signal of interest. Aerial color does not identify a particular nutrient deficiency, and reconstructed canopy height depends on the availability of a defensible ground reference.
Interpolation does not create new source detail. A smooth edge may be a mathematical mixture rather than an observed intermediate class or physical surface.

Prepare the inputs and the controlled test
Identify whether values represent continuous measurements, class identifiers, counts or densities. Choose a documented method appropriate to that meaning. Test a small extract with recognizable boundaries and known values. Preserve the original raster, target grid definition and validity mask so changes can be traced to the resampling operation.
Build the comparison around a preserved baseline. Use the same input inventory, geographic extent and independent reference observations whenever the experiment permits. Change one justified factor at a time and record any unavoidable difference. Select both a difficult inspection region and a stable control region before examining the candidate output. Compare on their common valid support, then report any gain or loss of total coverage separately. This distinguishes a local improvement from a result that merely excludes the hardest observations.
Independent verification in this setting
Check tree identifiers, recent pruning and replacement records in selected rows. Inspect uncertain crown boundaries and sample ordinary trees as controls. Where canopy size is reported, define whether the measurement is projected area, height above reference or another structural quantity. Retain original photographs and field evidence for locations where crowns overlap.
Compare selected values, class integrity and boundary behavior on common support. Review statistics using the correct units and denominator. Inspect for a half-cell displacement or unexpected smoothing. Confirm the receiving application reads the intended reference and numeric type.
A linked check: Independent Checkpoint Design
Independent checkpoints evaluate geometry without participating in the adjustment being tested. Their reference quality, distribution and feature identification affect the result. Points used as control cannot simultaneously provide an independent accuracy assessment of that same adjustment. A useful design covers the conditions relevant to the delivered product rather than clustering checks on the easiest accessible surface.
Define the intended horizontal and vertical checks before processing. Separate control and checkpoint identifiers and preserve their observation methods. Choose visible stable targets distributed across meaningful terrain and acquisition conditions. Document reference uncertainty and any target-identification limitations. Keep withheld points withheld during the comparison.
Inspect signed residuals, spatial patterns and outliers with their evidence. Investigate mistaken identification or changed targets rather than removing inconvenient points automatically. Compare candidates on the same independent set and report exclusions with reasons. Present the reference method so the residuals are not interpreted more precisely than the check observations allow.
An illustrative decision example
Consider an illustrative management polygon that overlaps several raster cells, with part of its area outside the valid observation mask. A summary computed only from valid cells can be useful, but it does not describe the entire polygon unless the missing portion is addressed appropriately. Report the coverage denominator with the statistic. If a later conversion changes the missing area to zero, the same polygon may acquire a different mean even though none of the observed values changed. Inspect selected cells, grid alignment and validity behavior through the actual export path. For a categorical raster, check class counts rather than averaging arbitrary class identifiers. This hypothetical comparison demonstrates why a successful file conversion and a plausible table are insufficient evidence of analytical equivalence. Preserve the source and receiving definitions so another analyst can explain whether a difference arose from a physical observation, a grid choice or a changed interpretation of missing data.
Interpret uncertainty before accepting the result
Write the acceptance rule before selecting the most attractive output. The actual threshold must follow the project purpose and the quality of the independent evidence. Inspect signed differences and spatial patterns as well as summaries. Investigate consequential outliers using their source observations instead of deleting them to improve a score. A result can be suitable for inspection planning while remaining unsuitable for a more demanding engineering or quantitative claim. State that intended-use boundary explicitly.
Deliver evidence that the next team can use
Deliver a tree register with observation date, visible structure and interpretation confidence. Keep management recommendations tied to verified field evidence. Explain which trees were unobservable rather than forcing every expected planting position into a complete-looking classification.
Keep the accepted source dates, processing version, coordinate conventions, masks and reference evidence beside the delivered data. Reopen a representative output from a clean copy and confirm that the intended receiving application interprets it consistently. Identify any remaining unsupported areas and the additional observation that would resolve them. The next analyst should be able to reconstruct the decision without depending on a temporary browser session, an operator recollection or a file whose name merely says final.
Where a cloud workflow can help
Drone Image Processing Software can simplify the transfer from an organized image collection to a shared review workflow, but it does not remove acquisition or validation responsibilities. Drone Collab can be considered as part of that workflow after the team checks the current published capabilities and the outputs required by the project. Start with a representative collection and evaluate the evidence, usability and handover together. Choose the workflow because it supports a defensible decision rather than because one preview looks particularly polished.